
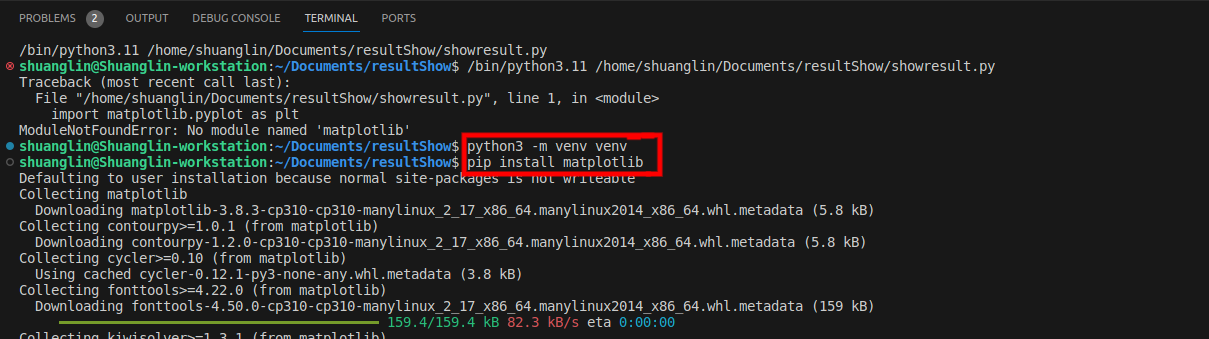
最近在使用Python生成数据分析报告过程中,需要使用3D效果的饼图,于是在网上找了一圈,matplotlib感觉做出来的效果不是自己想要的3D效果,其他的图形库,如plotly可以绘制,但是都是生成的html格式的,需要使用scree_shot等进行截图,使用Image或者kialedo等图片转换功能,由于电脑没带显卡,根本就运行不了。所以,就想着用ChartDirector生成所需饼图。
ChartDirecotr的安装
ChartDirector的Python版本安装可以非常灵活的将下载下来的压缩包解压到任何路径下,但是建议放在程序目录下,然后采用如下命令引入ChartDirecotr。
import sys
import os
sys.path.insert(0, os.path.join(os.path.abspath(sys.path[0]), "venv\Lib\site-packages\ChartDirector", "lib"))  # 这里是将解压缩后的文件夹里的lib文件路径加入到系统的Path路径中,实际就是注册里面的chart.dll文件,后面可以根据自己文件位置,修改路径文件夹
from pychartdir import *
Python 三维饼图的绘制
# The data for the pie chart
data = [25, 18, 15, 12, 8, 30, 35]

# The labels for the pie chart
labels = ["Labor", "Licenses", "Taxes", "Legal", "Insurance", "Facilities", "Production"]

# Create a PieChart object of size 360 x 300 pixels
c = PieChart(360, 300)

# Set the center of the pie at (180, 140) and the radius to 100 pixels
c.setPieSize(180, 140, 100)

# Add a title to the pie chart
# c.addTitle("Title of the pie chart")

# Draw the pie in 3D
c.set3D()

# Set the pie data and the pie labels
c.setData(data, labels)

# Explode the 1st sector (index = 0)
c.setExplode(0)

# Output the chart
c.makeChart("reports/images/threedpie.png")
运行上述代码,可以得到如下图形:
然而,你可能会发现,由于没有使用授权的ChartDirector,出现黄色背景以及未注册的字样。这里,你可以选择到官网注册一个账号,然后设置许可证文件或者在代码中插入许可证进行去除。当然,也可以通过重新读取图片,采用图片编辑工具切除图片,具体代码如下:
import PIL.Image

def crop(path):
    image = PIL.Image.open(path)
    xsize, ysize = image.size
    box = (1, 1, xsize - 2, ysize - 9)
    image.crop(box).save(path)

crop("reports/images/threedpie.png")
本文共 352 个字数,平均阅读时长 ≈ 1分钟


评论 (0)